Wealth in Waste: India’s Potential to Bring Textile Waste Back Into The Supply Chain
The State Of Textile Waste In India
Provides estimates for textile waste in India, its end use and material composition. Also highlights the flow of waste within and outside India
TYPES AND QUANTITY OF TEXTILE WASTE
8.5% of global textile waste, or 7793 ktons, is accumulated (generated and imported) in India annually. Illustration 9 demonstrates the total quantity of textile waste in India in three main waste categories: domestic post-consumer (51%), pre-consumer (42%), and imported post-consumer (7%).
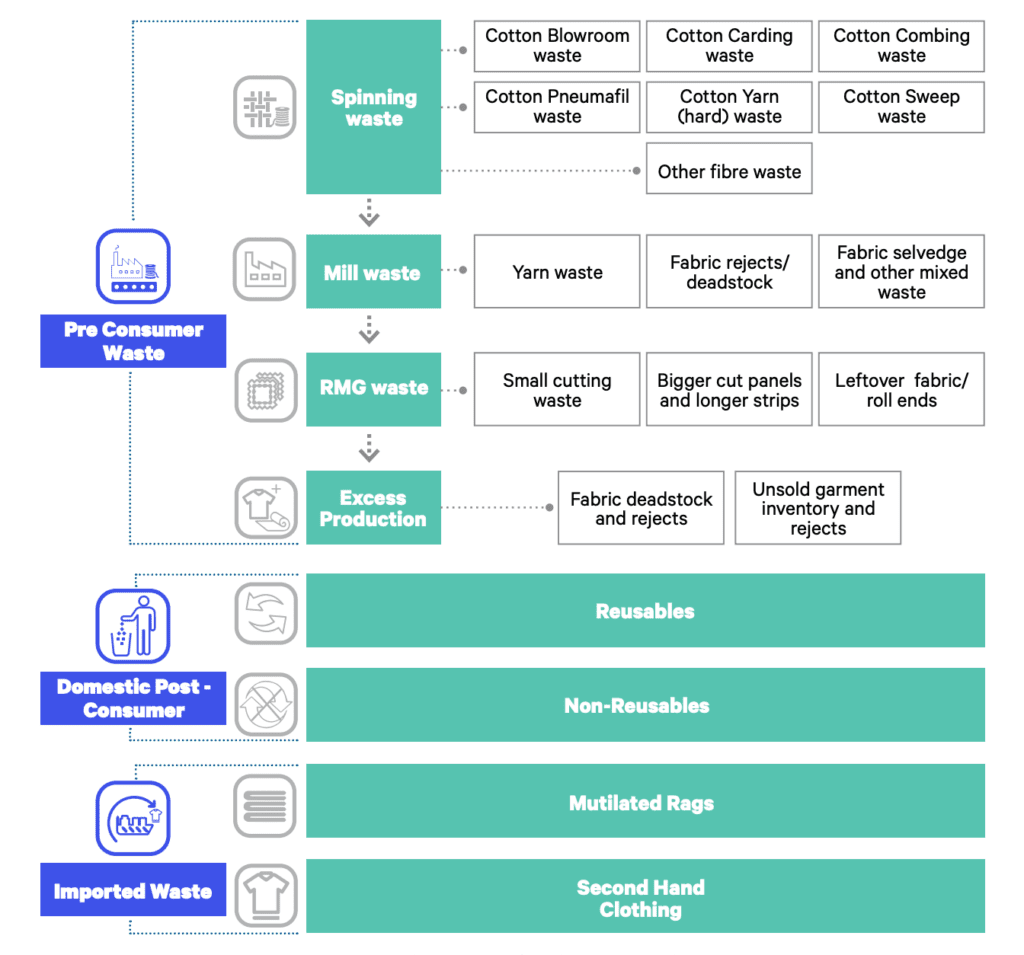
Illustration 9: Types of textile waste in India
Certain textile waste types included in this study (spinning waste, unsold or re-wearables garments, and fabric deadstock) are not considered textile waste as per GRS and RCS42 certifications. This study took a broad approach, as many stakeholders in the value chain consider these waste types as ‘textile waste’, and the value chain of reusable materials intersects with that of non-reusables and the process of handling these waste types also influences its end-use.
![]()
Illustration 10: Total quantity of textile waste in India and quantities by waste streams and types
Note:
1. The values represented above are measured in KiloTon (KTon)
2. Base value for % is total waste (7793ktons)
3. All The figures have been rounded off to the nearest whole number
TREATMENT OF TEXTILE WASTE
There are four options for the treatment of textile waste: Recycle, Reuse, Downcycle, and Landfill/Incineration. Recycling and Reuse account for 59% and the remaining 41% is downcycled for use in other industries or incinerated/landfilled.
Of the textile recycled, much of it moves through low grade recycling processes. Estimates suggest that 60-90% of recycled material is used for domestic markets but it is difficult to estimate the exact proportion of low-grade recycling due to multiple material compositions and market factors.
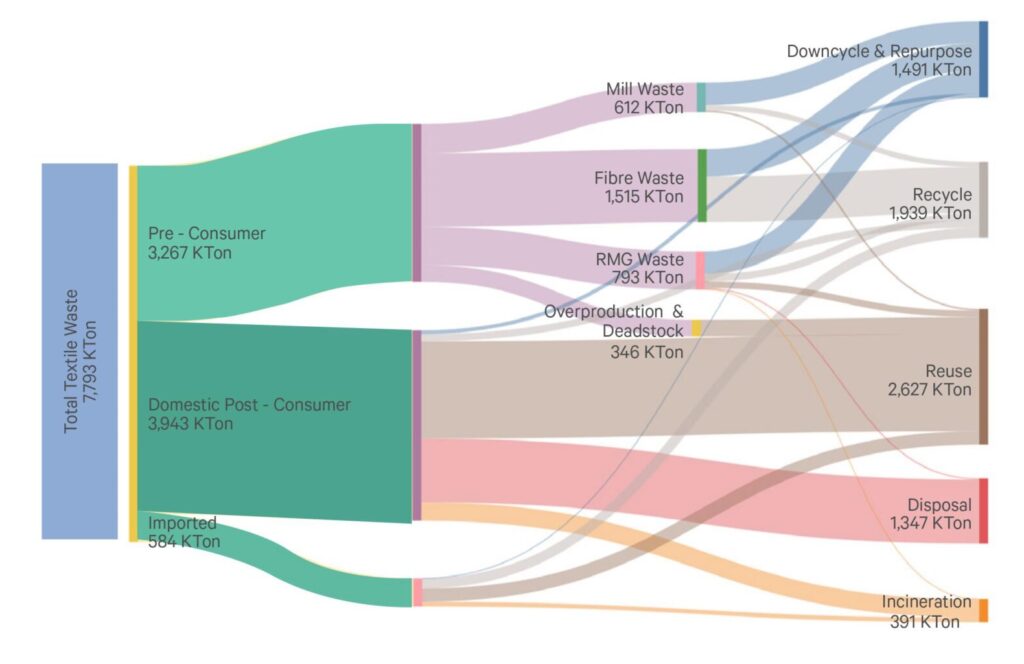
Illustration 11: End-use of textile waste in India
The treatment of waste across the three types; pre-consumer, post-consumer, and imported, varies greatly depending on the use case. Of the total pre-consumer waste, only mill waste and overproduction waste is being reused, while cutting waste appears to have multiple applications depending on its quality. More than 50% of the domestic post-consumer waste consisting of second-hand clothing is sold for reuse in the Indian domestic market. Recycling and downcycling use cases for this waste type are limited, and a large proportion (39%) is diverted to incineration for energy and landfill. Further, 64% of the imported textile waste is either being recycled into yarn or exported for reuse. While recycling of imported waste mostly takes place within India, second-hand clothing can be re-exported to Africa and Europe for reuse post sorting processes in India.
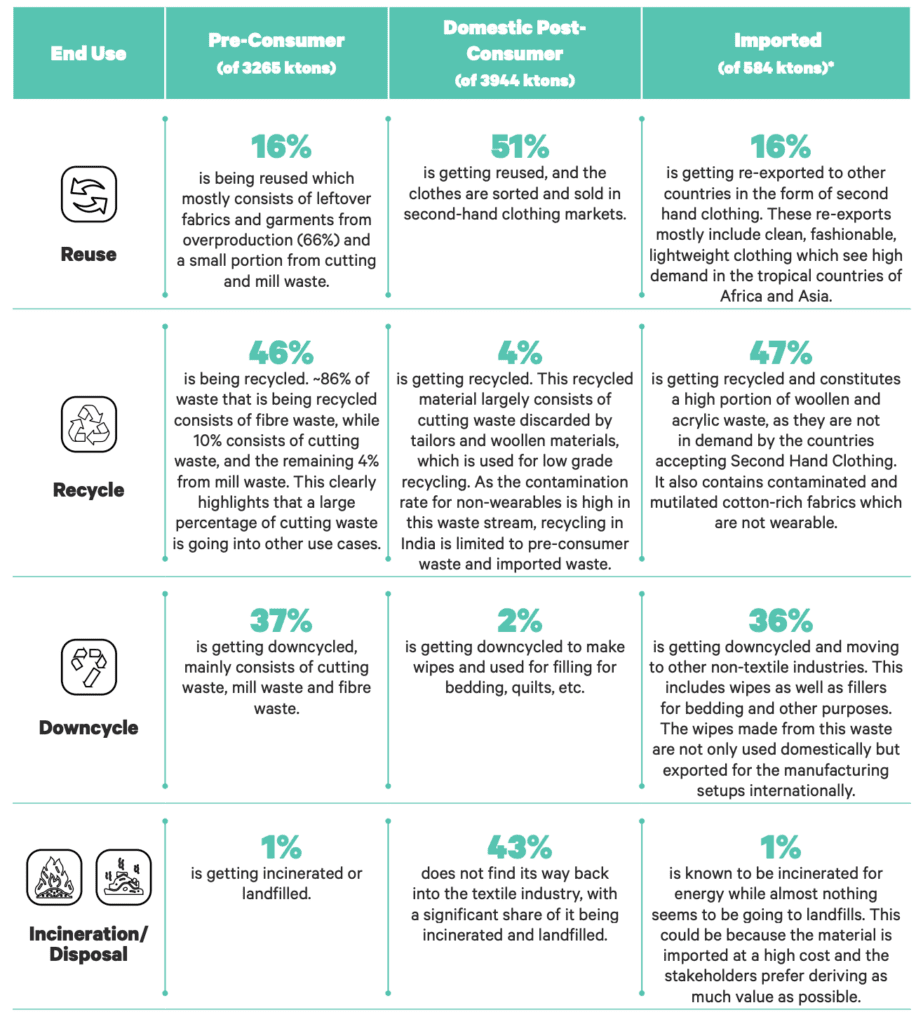
Illustration 12: End-use of textile waste split by waste streams
* A sizable share of the total imported waste, while not permitted, is known to be leaked into the domestic market for repair and resale in local markets. This quantity was difficult to estimate as there are multiple points of leakages across the value chain. Additionally, due to the highly informal nature of this value chain, the study could not access stakeholders dealing with this waste and estimate its quantity.
COMPOSITION OF TEXTILE WASTE
61% of textile waste mainly consists of cotton and cotton blends in India, however, there is a growing trend of polyester and other synthetic blends, which currently forms approximately 19% of total waste generated.
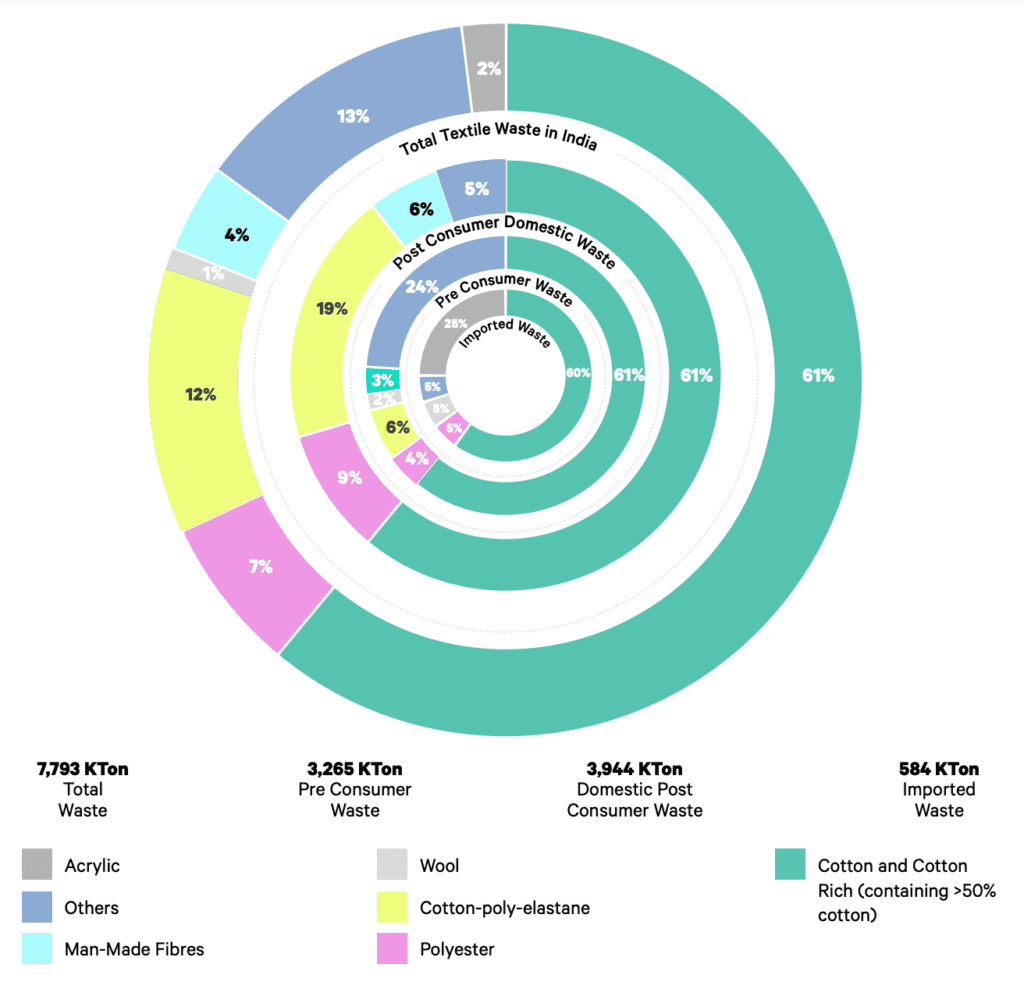
Illustration 13: Material composition of textile waste in India
The Indian textile industry uses a wide variety of fibres, ranging from natural fibres such as cotton, jute, silk, and wool, to synthetic fibres such as polyester, elastane and man-made cellulosic fibres (viscose, for example) among others. 44 While a majority of fabrics and garments in India are cotton and cotton rich blends (blends with at least 50% cotton composition), 24% of total apparel produced is comprised of other blended fibres. While these fibres individually do not form a large share, they collectively form 1018 ktons (13%) of total textile waste Illustration 13: Material composition of textile waste in India Composition of textile waste Acrylic 7,793 KTon Total Waste 3,944 KTon Domestic Post Consumer Waste 3,265 KTon Pre Consumer Waste 584 KTon Imported Waste Others Cotton-poly-elastane Man-Made Fibres Polyester Wool Cotton and Cotton Rich (containing >50% cotton) generated, denoting the need to institute waste management processes for waste beyond cotton and cotton rich blends.
Over the last five years, there has been a considerable increase in the quantity of synthetic textile waste, specifically polyester.45 Currently synthetic fibres account for 19% of the total textile waste, but this is anticipated to increase given market demand.
Polyester’s high stain resistance and low economic cost has made it a desirable raw material for the fast fashion industry.46 Global estimates suggest that polyester formed 52% of total fibre manufacturing in 2020 and between 2000 to 2015, polyester production increased by 157%.47 48
In addition to increasing production of fabrics and garments made out of polyester domestically, India also imports man-made filament yarns, fabrics and apparel. Between 2016 to 2018, the import of polyester yarns increased by 94% and that of apparel made out of polyester increased by 30%. 49
While synthetic materials already represent a higher proportion of domestic post-consumer waste (28%), compared to other waste streams, its share in imported waste streams has risen over the last five years, with importers in the KASEZ increasing as high as 10% in some cases.50 In the pre-consumer waste stream, approximately 10% of the production and subsequently textile waste consists of synthetic materials. This highlights the need for dedicated efforts towards devising and investing in recycling technologies that will enable suitable recycling of these materials.
GEOGRAPHICAL FLOWS OF TEXTILE WASTE
Most of the textile waste that is generated domestically and imported to India converges at Panipat and Tirupur, which are major recycling hubs in the north and the south of the country, respectively. Additionally, medium and small scale recycling facilities are prominent in Amroha and parts of Rajasthan, Madhya Pradesh, Punjab and Gujarat which have medium to small-scale recycling facilities.
According to the 2018-19 industry survey, Gujarat, Karnataka and Tamil Nadu are the largest textile and apparel hubs in India, collectively producing more than 56% of the textile production and 51% of annual apparel production in the country.51 Beyond these three states, medium to small-scale manufacturing clusters are present in multiple states as shown in illustration 16, leading to high waste generation across India.
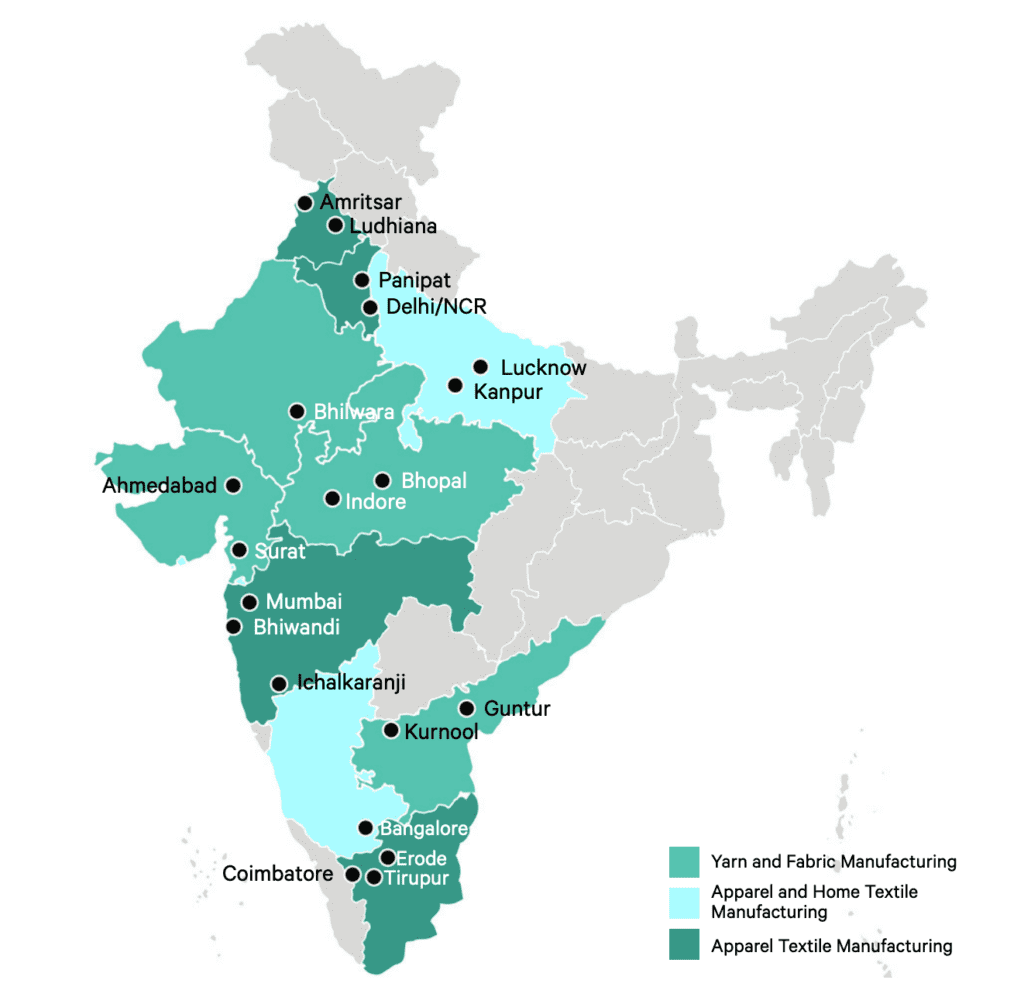
Illustration 14: Key manufacturing locations in India
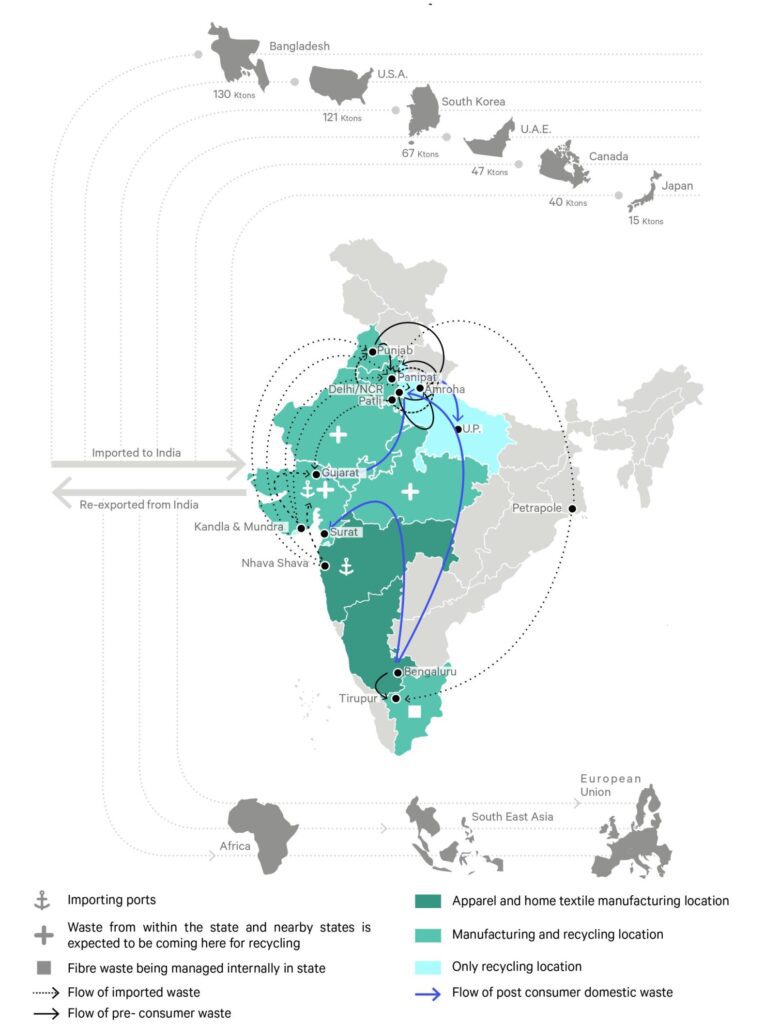
Illustration 15: Textile waste flows within and outside India
Extensiveness of textile waste in India
- The pre-consumer, domestic post consumer and imported waste results in the generation of 7793 k tons of textile waste in India annually, forming 8.5% of global textile waste.
- Out of the total waste generated, 59% is reused or recycled. However, out of this share, only 10-40% returns to the global supply chains. 43% of domestic post-consumer waste ends up in landfills as compared to 1% of pre-consumer and imported textile waste.
- At present, nearly 61% of the total waste generated in India is cotton-rich material. However, there has been a considerable increase in the quantity of synthetic textile (especially polyester) waste over the last five years.
- Panipat and Amroha serve as key recycling clusters for pre-consumer waste generated in Northern parts of the country and imported second hand clothing waste. Most of the waste generated in South India is transported to the Tirupur-Coimbatore- Erode recycling belt.