The Rise of Reusable Packaging: Understanding the Impact & Mapping a Path to Scale
Findings
Findings
IMPACT HOTSPOTS
The first test was to demonstrate where within the life-cycle of each system the impact occurs – known otherwise as the impact hotspots. In doing so, the absolute difference in emissions and eco-costs associated with each system were clarified.
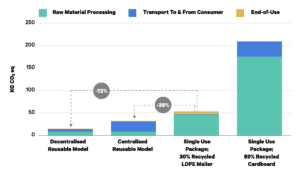
FIGURE 5
Eco-costs are the costs which should be made to reduce the environmental pollution and materials depletion in our world to a level which is in line with the carrying capacity of our earth. Eco-costs can be considered as ‘virtual costs’, as they take into consideration the integration of environmental costs that are not integrated in the real life costs of current production chains. It is a composite measure, involving 17 indicators, that measure a range of impact categories: including resource scarcity, carbon footprint, ecosystem and human health. The output if the calculation is expressed in a monetary value – providing a simple and concise means to compare impact holistically.
– TU Delft (2020)
From the above, it is clear that the decentralised reusable model has the lowest emissions of any of the models, with a relatively higher portion attributed to the raw materials and processing stage compared with the centralised model. This is because the centralised package has the extra transport emissions associated with travelling to and from the cleaning/maintenance node. In the centralised reusable model, both the CO2 eq emissions and eco-costs are considerably lower than in either of the single-use examples, with a much greater proportion of emissions coming from the transportation phase. This is to be expected, given reusable systems are built off the same package (asset) being transported to and from consumers over multiple cycles – thus dividing the raw materials and processing phase over many cycles.
Another noteworthy finding lies in the amount of emissions per cycle attributed to cardboard versus the LDPE mailer. The LDPE mailer, in terms of carbon emissions, has a quarter of that in cardboard (54kg vs 210kg respectively). What is more, LDPE mailers have roughly half of the eco-cost compared with cardboard (€~23 vs €~43) – given the eco-cost is a composite indicator that accounts for more than just carbon emissions.
In this context, the reason for the increased emissions associated with cardboard over LDPE mailers is due to the weight of the package required. The weight of the cardboard is over ten times that of a LDPE mailer, generating greater carbon emissions in the raw materials and processing phase. Moreover, the extra weight has significant implications on the transportation phase – with cardboard having over thirty times more carbon emissions compared with the LDPE mailer during this phase, per cycle.
Despite the greater carbon emissions of cardboard, environmental impact is a multifaceted issue that must be evaluated as such. LDPE mailers are a fossil-fuel derived, non-renewable resource that pose grave threats to the environment beyond the carbon emissions. Plastic packaging, in all its forms, has much lower recycling rates than paper and cardboard. In fact, it was recently reported that more than double the proportion of paper and cardboard packaging (>80%) is sent for recycling compared with plastic packaging (40%) in Europe.43,44 On a global level, that figure is much lower, with The Ellen MacArthur Foundation (2017) suggesting that only 14% of plastic packaging is recycled.45 Moreover, (most) plastics are non-biodegradable and can take centuries to decompose, discharging into the natural environment. This is exemplified by estimates that suggest over 8 million tonnes of plastics find their way into the ocean annually and, with a business-as-usual approach, there will be more plastic (by weight) than fish in the ocean by 2050.46 Therefore, whilst LDPE mailers have a lower carbon footprint, the lower recycling rates suggest they are further from achieving key circularity ambitions.
Now that the impact within and between each model has been demonstrated, the following section turns to assessing the sensitivity of select variables on the reusable versus single-use context.
SENSITIVITY ANALYSIS
In order to assess the feasibility of reusable packaging for fashion e-commerce, the main factors that affect the environmental impact of the system were identified.47 These factors present potential trade- offs in impact between material production and disposal on one hand, with the impacts associated with increased transportation on the other.48 Moreover, the factors also consider the disposal and recycled content of the packaging used in the single-use system.
These are as follows:
- Sensitivity test #1: The impact of increasing the distance travelled from the consumer to the cleaning node in a centralised reusable system versus a single-use LDPE mailer with 30% recycled content
- Sensitivity test #2: The impact of increasing the non-return rate of packages in a centralised reusable system versus a single-use LDPE mailer with 30% recycled content
- Sensitivity test #3: The impact of increasing the non-return rate of packages in a decentralised reusable system versus a single-use LDPE mailer with 30% recycled content
- Sensitivity test #4: The impact of changing the type of packaging material used in single-use packaging compared with a centralised reusable packaging system:
- LDPE plastic mailer with no recycled content
- LDPE plastic mailer with 80% recycled content
- Cardboard packaging with 89% recycled content
In each instance, the variable of average distance from distribution centre (DC) to consumer is used on the y-axis. This is to demonstrate the effect that changing overall transportation distances can have on each system, and to account for one of the three impact hotspots across all systems – transportation emissions.
Sensitivity test #1
The impact of increasing the distance travelled from the consumer to the cleaning node in a centralised reusable system versus a single-use LDPE mailer with 30% recycled content.
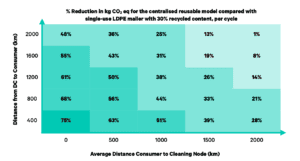
FIGURE 6
FINDING:
The purpose of this analysis was to evaluate the impact that total distance travelled has on the viability of the reusable system. The above table demonstrates that, the further the reusable package travels from the consumer back to the cleaning node, the lower the reduction in CO2 eq emissions compared with LDPE single-use packaging. This is simply due to the emissions associated with greater transportation distances. However, even with the package travelling a total distance of 4000km (2000km distance from DC to consumer plus 2000km distance consumer to cleaning node), there is a 1% carbon emission reduction compared with single-use plastic, thus highlighting the environmental impact viability of the system even across long-distances. Looking at the centralised base example (1500km from consumer to cleaning node, 400km from DC to consumer), it has a 39% carbon emission reduction compared with a LDPE plastic mailer, per cycle.
The impact of increasing the non-return rate of packages in a centralised reusable system versus a single- use LDPE mailer with 30% recycled content.
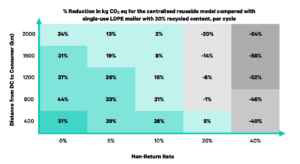
FIGURE 7
FINDING:
The purpose of this test was to evaluate the significance of the non-return rate on the viability of the reusable system. From this analysis, we can see that the return rate of reusable packaging is central to its feasibility. Beyond a 20% non-return rate, the reusable package must travel a maximum of 400km from the DC to the consumer to present a reduction of CO2 eq emissions compared with a 30% recycled LDPE mailer. This is because, in theory, the manufacturing and processing impact of reusable packaging is divided over multiple cycles; however, if the non-return rate is above a certain point (20% in this instance), the impact associated with having to replace those packages outweighs the benefits associated with the reusable system.
Sensitivity test #3
The impact of of increasing the non-return rate of packages in a decentralised reusable system versus a single-use LDPE mailer with 30% recycled content.
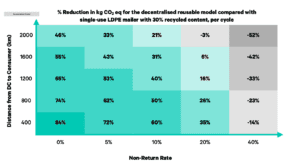
FIGURE 8
FINDING:
In this example, the cleaning node was removed from the analysis. As mentioned, many reusable systems are emerging, one of which is the decentralised system. In this scenario, the cleaning/maintenance of the packaging takes place in the brand’s DC, thus eradicating the need to transport the package to an additional node. Removing the centralised cleaning node has less transport emissions associated, thus it was found that reusable packaging has an improved carbon impact compared with the centralised system. Looking at the base case, there is a 72% reduction in carbon compared with the single-use LDPE mailer, per cycle. What is more, this system affords greater tolerance for higher non-return rates – which can be as high as 30% and still present a favourable case from a carbon emissions perspective. The same sensitivity analysis was conducted for the decentralised system versus a single-use LDPE mailer with no recycled content. It was found that there is an 82% reduction in CO2 eq emissions compared in the decentralised reusable system compared with virgin LDPE packaging, using the base case variables.
Sensitivity test #4
The impact of changing the type of packaging material used in single-use packaging compared with a centralised reusable packaging system:
- LDPE plastic mailer with no recycled content
- LDPE plastic mailer with 80% recycled content
- Cardboard packaging with 89% recycled content
1. LDPE plastic mailer with no recycled content
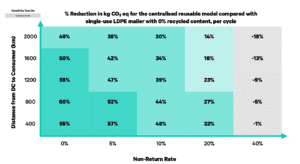
FIGURE 9
FINDING:
Whilst the base for the analysis was grounded on single-use packaging with 30% recycled content, in- keeping with incoming UK legislation, the same comparative analysis was conducted using single-use packaging with 0% recycled content.49 Changing the base scenario to LDPE packaging with 0% recycled content further improves the viability of reusable packaging. The impact hotspot demonstrates that over three quarters of the associated emissions in single-use packaging come from the raw material and processing phase, and so changing the composition of the packaging has significant implications on the total carbon emissions. In this instance, a 40% reusable packaging non-return rate still reduces the CO2 eq impact by 2% when travelling 200km from DC to consumer, thus tolerating 20% higher non- return rates than in Sensitivity test #2. Moreover, the point at which reusable packaging increases CO2 eq emissions in Sensitivity test #2 (20% non-return rate, 800km distance from DC to consumer), boasts a 23% reduction in CO2 eq emissions per cycle in this context – clearly demonstrating that recycled content of the single-use packaging influences the viability of the reusable system.
2. LDPE plastic mailer with 80% recycled content
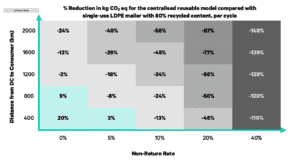
FIGURE 10
FINDING:
On the other hand, from the graph above, it is clear that increasing the recycled content of single-use packaging is an effective means to lowering the associated carbon emissions. 80% recycled content was chosen for this analysis as it is the minimum required to fulfill the ‘Blue Angel’ (Blauer-Engel) EcoLabelling standard, thus providing a realistic benchmark.50 In this instance, with 80% recycled content LDPE packaging, reusable packaging only reduces CO2 eq emissions when the non-return rate is 5% or less. The package also cannot travel further than 1000km from DC to consumer without an increase in CO2 eq emissions, even with a 0% non-return rate. The base case of 5% non-return rate and 400km distance from DC to consumer presents a 3% reduction of emissions compared with single use packaging. This is a 36% reduction difference with Sensitivity #2 and 54% reduction difference with Sensitivity #4a – highlighting the influence that high recycled content of LDPE packaging has on the viability of the reusable system.
3. Cardboard packaging with 89% recycled content
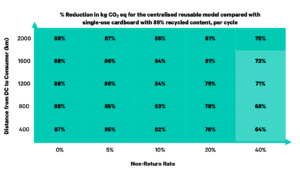
FIGURE 11
FINDING:
When comparing the reusable system with cardboard with 89% recycled content, it is clear that reusable packaging reduces carbon emissions drastically (between 64% – 88%) per cycle. Reusable packaging can tolerate non-return rates of 40% and travel distances of 2000km+ between DC to consumer and still reduce carbon emissions by over 60%. Interestingly, in this context, the % reduction in CO2 eq emissions actually increases as the distance travelled by the package increases, contrary to that in the LDPE mailers context. This is because, as previously mentioned, the weight of cardboard makes the transportation phase a key source of emissions. Therefore, despite the emissions associated with the return transport phase in the reusable context, the CO2 eq emissions from cardboard packaging remain greater.