Sorting For Circularity Europe: An Evaluation And Commercial Assessment Of Textile Waste Across Europe
Annexes
ANNEX I – SORTING ANALYSIS METHODOLOGY
The composition analysis for the Sorting for Circularity Europe project was conducted in three phases: Preparation, Implementation and Reporting. An overview of the approach and methodology involved in each phase can be found below.
PREPARATION
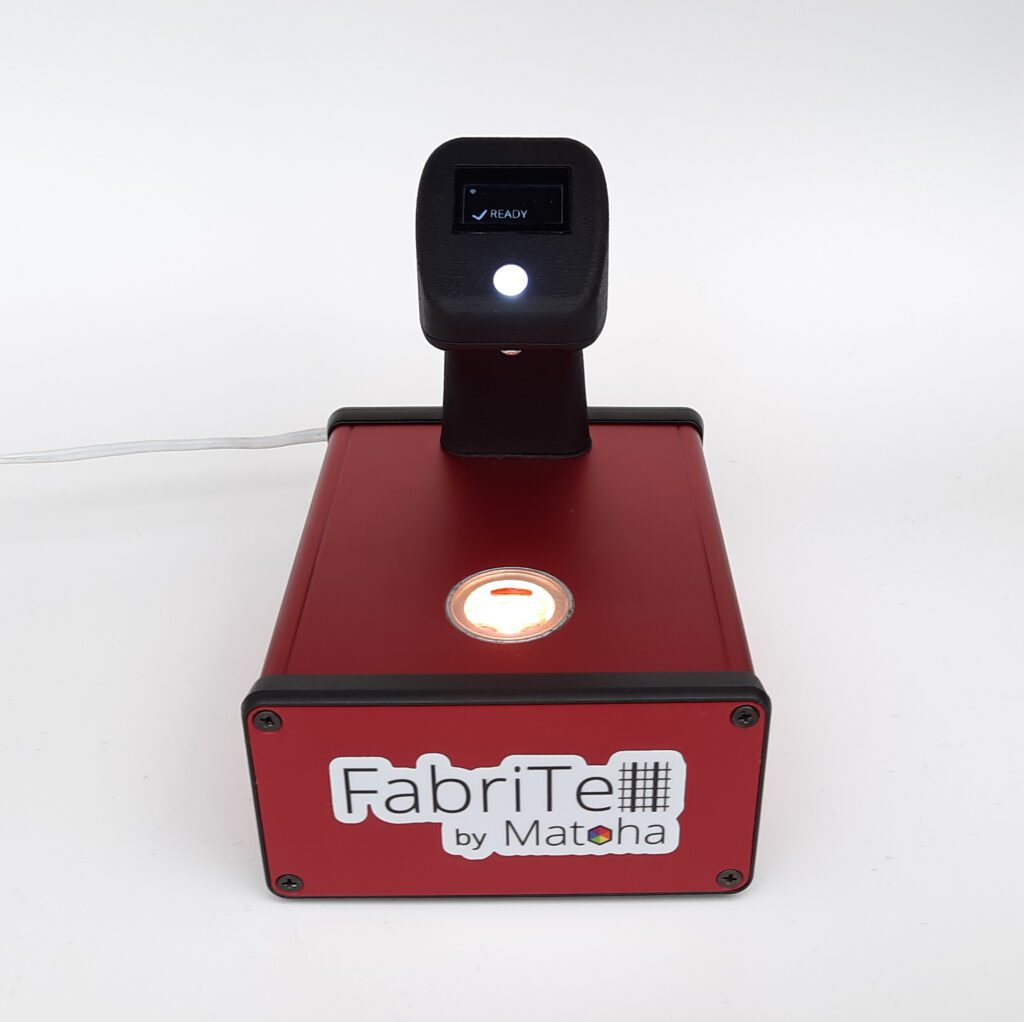
Image 8: Matoha NIR handheld scanner (Source: Matoha)
Co-creation of research methodology for on the ground analysis
The methodology for the on-the-ground research builds on the process used in a previous study by TERRA to map textiles in France, within their research commissioned by Refashion.91 In close collaboration with TERRA, this methodology was adapted and fine-tuned to the analysis scope of the Sorting for Circularity Project, relying on the participation of sorting facilities for its implementation.
Translation of methodology to operational protocols per sorting facility
Based on in-depth interviews with each of the participating sorting facilities, an operational protocol has been established for each of them. This protocol is a specification of the overall methodology that reflects the internal configurations of the sorting facility. As all sorting facilities categorise textiles into different fractions, the protocol describes on an individual basis which fractions will be used for the analysis.
Preparation of the data collection templates
Circle Economy and TERRA, in collaboration with Fashion for Good and participating sorters, have created the data collection template that was used in all on the ground analyses. Data was collected using an NIR scanner and an app on an electronic device (ie. tablet). Together with the supplier of the NIR scanners and app, the correct configuration for the analysis equipment was determined and developed.
Testing and refining the methodology and schedule through a process dry-run
The process for the on the ground analysis has been tested at small scale with one of the participating sorters to assess whether the process is clear and the app used allows for accurate and complete data to be captured. Besides, this dry-run has informed sorting facilities on the capacity required to analyse items, since the use of the NIR scanner and app will reduce the volume a sorter can process per hour. Learnings from the dry-run have been shared with all participating sorters, and the methodology has been adapted where needed.
Training sorters (and/or students) for NIR device use
Sorters and/or students that will participate in the on-the-ground composition analysis during the Implementation Phase were trained in the use of the NIR device and the input of information to the app. This entailed up to one hour training at each participating facility (or warehouse) where the analysis took place, at the start of the first composition analysis round.
IMPLEMENTATION
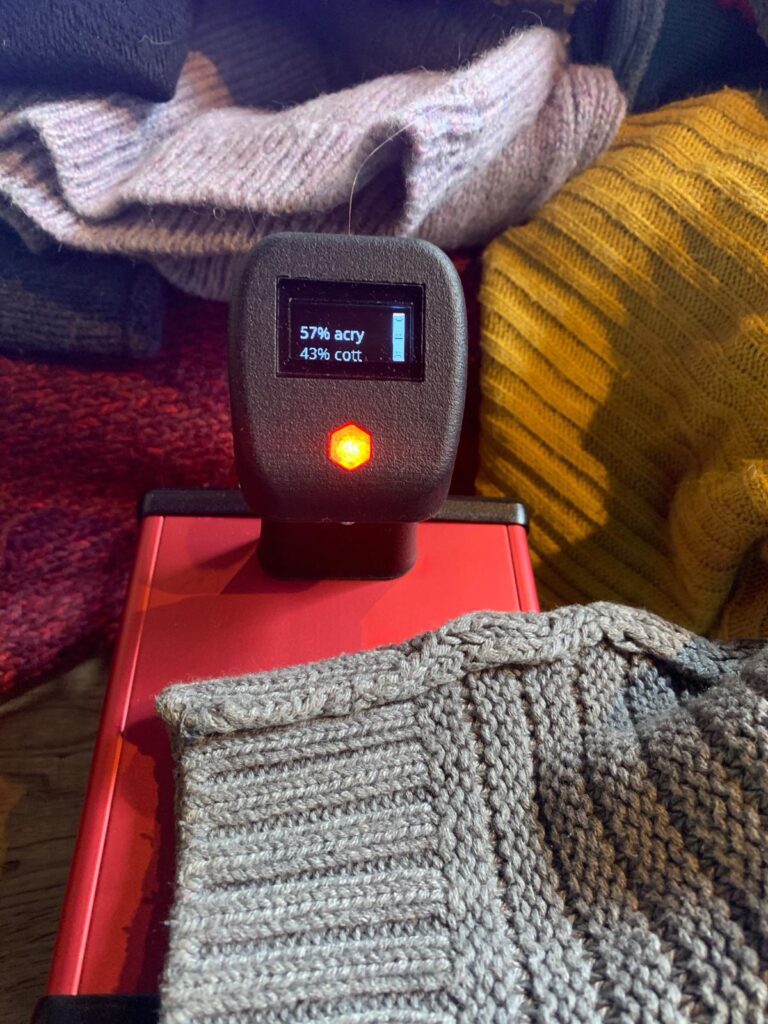
Image 9: Composition scan using Matoha NIR handheld scanner (Source: Matoha)
Once the preparatory phase was completed, the on-the-ground analysis at sorting facilities started. The analysis followed the following standardised process:
Workplace preparation
The sorters (and/or students) conducting the analysis needed to be able to scan garments using an NIR hand scanner, and log additional information using an electronic device like a tablet or smartphone provided by Fashion for Good. The workplace had to allow sorters to use this equipment. It was crucial that textiles were only analysed once, so there had to be a clear workspace distinction between not yet analysed and analysed textiles to avoid double-counting.
Provision of materials
Each sorting facility identified the fractions in scope for analysis with origin in the focus country from representative collection sources prior to the start. This selection was predefined bilaterally and agreed upon by the sorter and Circle Economy, in coordination with TERRA. This was a representative sample of the fractions in scope, however, the exact distribution of the tonnage over the different categories each sorting facility sorts into, as well as the baling volumes and structure of operations at each facility were the key parameters for this definition. In case multiple bales from one fraction were selected from storage for this analysis, non-subsequent bales had to be selected to maximise their representativeness.
Capture of garment characteristics
The on the ground analysis consisted of two main activities:
- The garment was scanned by a sorter/student using the NIR handheld device, to assess its composition. In case the garment consisted of different fabric types or layers, these components were scanned separately.
- Other characteristics of the garment like product type, age group, colour and presence of disruptors were captured in the app on the electronic device through a short predefined multiple choice survey.
The first hour of the analysis was used to calibrate the NIR scanners, train sorters to use the App correctly and get up to speed. Throughout the first hour the process and workplace were adjusted to maximise the process efficiency and output capacity. Once things were going smoothly, the process was repeated for the available time.
Quality control
Throughout the on-the-ground analysis, a representative from TERRA and/or Circle Economy verified that the implementation of the process was in line with the predefined methodology. These external representatives executed labels-based checks in case the NIR scanners did not capture the fibre composition. Cross-checks were executed in case the composition indicated by the scanner was questioned by the sorter, in which case the label information was mostly used for the analysis. Materials that were often not well recognised are described in Annex II of this report.
Student participation
If needed, sorting facilities could invite students to participate in the on the ground analysis to complement the sorters and increase capacity. Students were selected in close collaboration with Circle Economy, and received the same training as the sorters staffed on the analysis to ensure they have the competences to provide reliable, comparable data.
DATA EXTRAPOLATION
Conversion from data points into weight equivalents
The sample data was collected in .csv format and anonymised (sorting facility and fraction name) before further use. The feedback from the on-the-ground team on data points to remove or modify was incorporated into the database. The on-the-ground analysis gathered data per item, whilst this Project explores potential volume available for fibre-to-fibre recycling. Data points were converted into weight equivalents using average weight estimates per product type and product age group (listed in Annex III). Data points without a product type or product age group were removed from the data set as they could not be translated into weight equivalents.
Extrapolation to country level volumes
The sample data was extrapolated to country level volume estimates, using weight data from textiles collected in the focus countries available through prior literature.92 Since a similar amount of items was analysed for each of the product categories, whilst in reality the categories can differ considerably in size, a multiplier was determined per country, per product category to generate a dataset that is representative of a sorter’s reality. A multiplier indicates the amount of times the characteristics of one item were used to generate an estimate on the composition of country level volumes. For instance: an item weighing 0.250 kilo with a multiplier of 33,000 would account for 8,250 kilo in the country level volume. The table below lists the average multiplier per country and the range of multipliers used for underlying product categories.
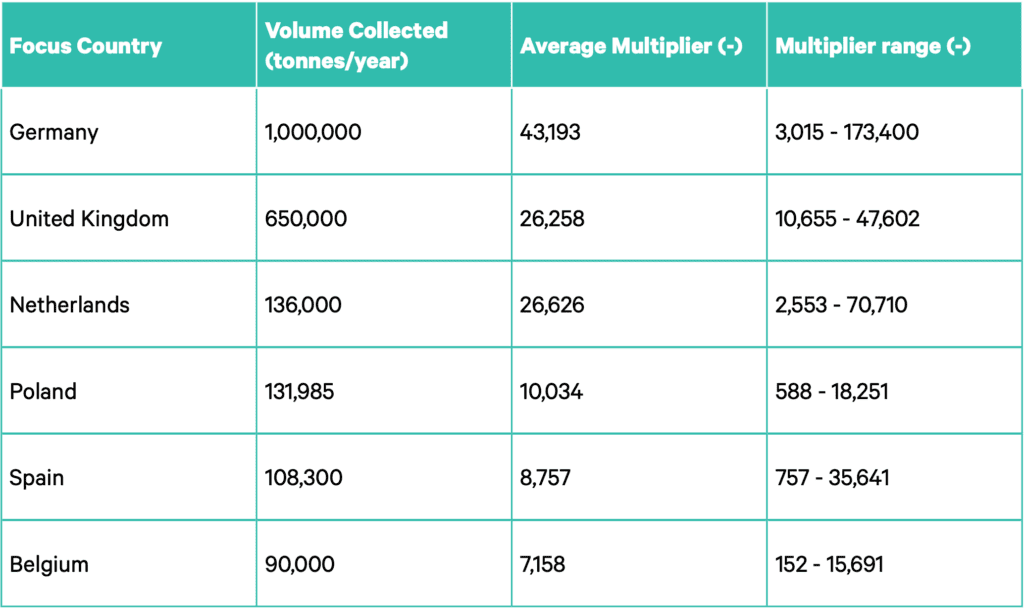
TABLE 2: DATA EXTRAPOLATED TO COUNTRY LEVEL VOLUMES. SOURCE: CIRCLE ECONOMY AND FASHION FOR GOOD (2022)
ANNEX II – STUDY LIMITATIONS
Whilst NIR scanners allow for the automated recognition of the composition of textiles, the outcomes of this Project have been prone to human error. Data from the scanners were complemented with information of other characteristics of the textile product using an app. In the first round of the on-theground analysis, data inserted into the app had to be cleared after saving which was forgotten at times leading to characteristics of one item (like fraction, product type, presence of disruptors, and colour) being copied to a next one. On-the-ground quality controllers were available to ensure data was inserted adequately or corrected afterwards, but human errors certainly occurred throughout the data collection.
The conversion from data per item to a volume equivalent was based on average weight per product type, instead of each item’s actual weight. To maximise the volume that could be scanned in the time available for this Project, scanned items were not weighed individually. The product type and age group was captured per item using the App. The composition and characteristics were translated to a volume estimated based on average weight per product type, per age group. The average weights used were based on estimates received from textile retailers and data from Refashion93, resulting in the average weight per product type shown in Annex III. The overall gap between the weight actually scanned and the estimated weight used is +6%. Saved items without a product type or age group were deleted from the sample as no reliable weight could be associated with the product. The weight of multi-layered items was equally attributed to both layers. As multi-layered items were excluded from the sample used to calculate feedstock availability this limitation does not affect the study outcomes.
NIR-based technologies enable efficient recognition of the composition of textiles, but there are limits to their accuracy. The thickness and colour of fabric scanned as well as presence of coatings and finishes can reduce the accuracy of the composition analysis of NIR scanners94. In this analysis blends were only recognised upto combinations of two fibre types, and fabrics consisting of natural or synthetic leather, linen and PU coated fabrics were not detected by the NIR scanners used. The lack of ability to recognise the presence of elastane is a major limitation of NIR technologies considering the abundant presence of elastane in textiles sold on the market.95 Another limitation is its inability to detect composition when textiles are dyed with carbon black ink.
Feedstock estimates were created by extrapolating the research sample to country volumes: an average extrapolation factor of 33,000 times. This means every item scanned was counted 33,000 times on average to constitute an estimate on the characteristics of PCT in the focus countries. Analysing 21,800 kilos of textiles is a vast endeavour, and whilst this is a considerable research sample its representativity for the total volume of the Fraction (estimated at 673,000 tonnes per year in our focus countries) is limited. Estimates on feedstock volumes per material type can therefore only be considered estimates and should be refined by expanding the sample volume in the future.
Data on the fabric structure (knitted or woven) was not captured in this study. As mechanical recyclers mostly process knitted textiles and denim trousers, feedstock estimates for mechanical recycling in this report are higher than the actual volumes available. Based on product categories, around 14% the volume in the estimated volume of feedstock for mechanical recycling consists of products with woven fabric structures like trousers (non-denim), jackets and coats.
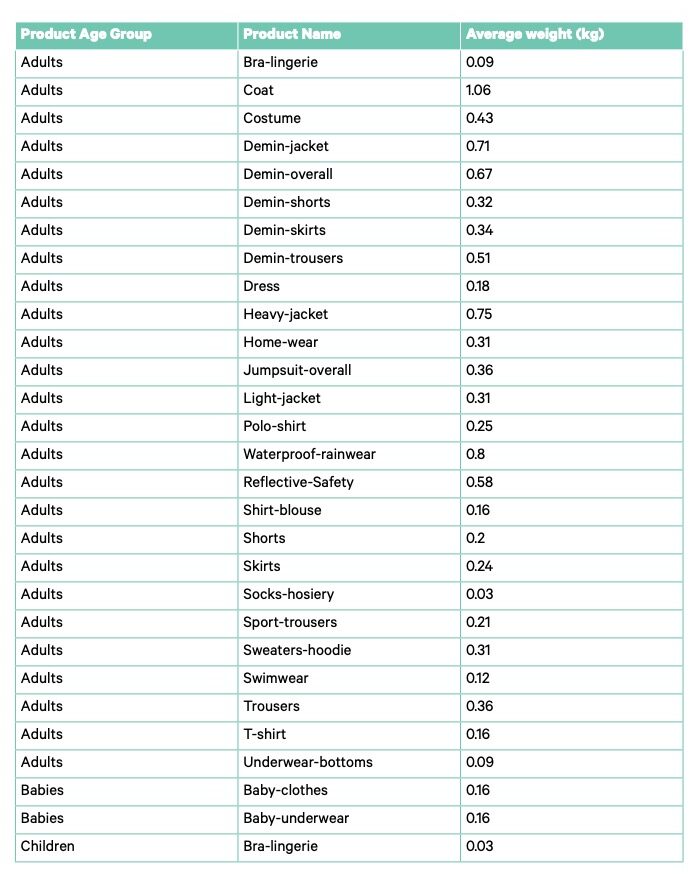
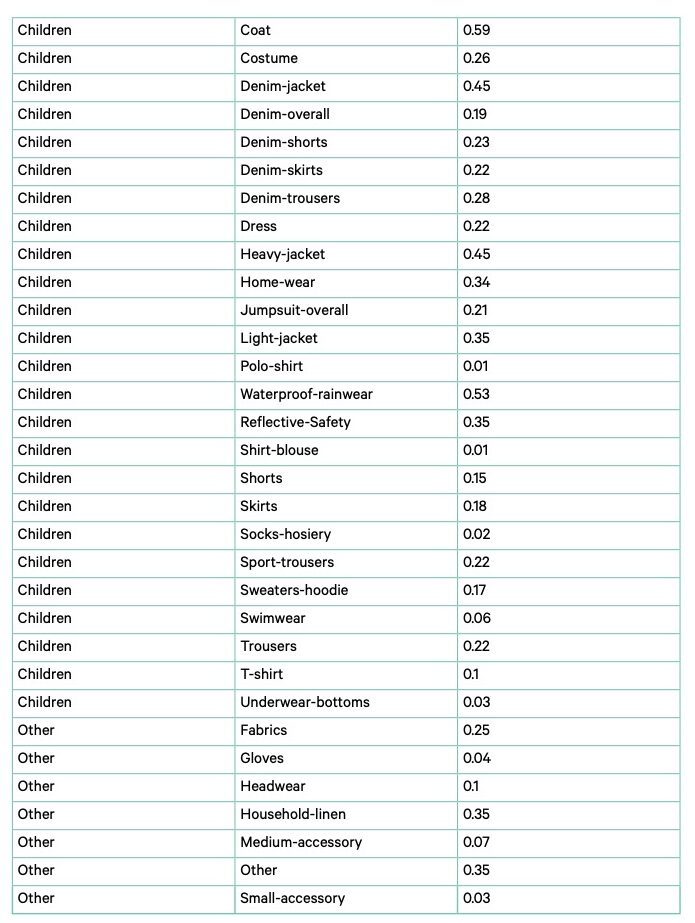
TABLE 3: ESTIMATES ON AVERAGE WEIGHTS PER PRODUCT TYPE. SOURCE: CIRCLE ECONOMY AND FASHION FOR GOOD (2022)