Sorting For Circularity Europe: An Evaluation And Commercial Assessment Of Textile Waste Across Europe
Fibre Types In The Fraction
Phase 1
The outcomes outlined in this report are based on the analysis of a sample of 90,777 items of PCT from categories included in the Fraction, originating from collection schemes in the six focus countries. Based on average product weights per garment type and age group, the total volume of the sample is estimated at 20,523 kilos. 53
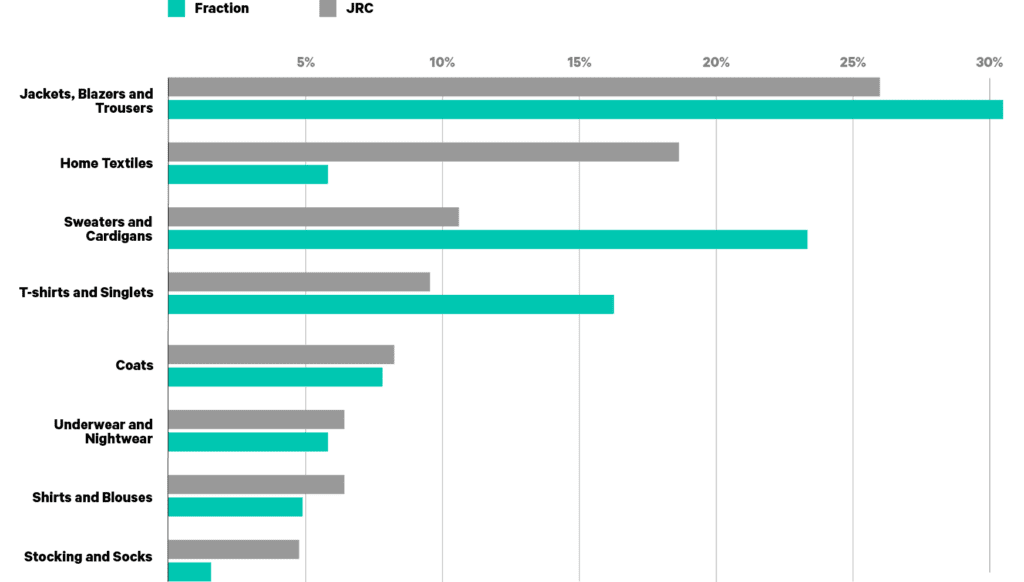
FIGURE 6: COMPARISON OF THE PRODUCT CATEGORY BREAKDOWN OF THE FRACTION TO THE GARMENT PRODUCT TYPES PLACED ON THE EUROPEAN MARKET. SOURCE: JRC (2021), CIRCLE ECONOMY AND FASHION FOR GOOD (2022)
In the Project, tops like sweaters and t-shirts are over-represented in the Fraction compared to garment types sold on the European market, while home textiles are underrepresented. The overrepresentation of these product categories, illustrated in Figure 6, most likely reflects the current most prevalent destinations for non-rewearable textiles as feedstock for mechanical recycling (with preference for wool- and cotton-rich items) and the wipers industry (with preference for garments that allow for cutting out large pieces of fabric, like tops). Another explanation could be that bottoms, like trousers, tend to either be too worn out at time of disposal. In this case these garments are more likely to end up in household waste than in textile collection bins, or are not worn that often and sold for reuse on second-hand markets. Home textiles are underrepresented in this Project, accounting for only 5% of the research sample whilst representing 19% of the volume consumed in the EU each year.54 This difference is due to the fact that home textiles can often be resold on the global second-hand markets.55
Besides, the Sorters participating in this study were mostly keen on exploring the composition of garments due to the very large variety of product types found in this product group. The overrepresentation of garments should be taken into account in the interpretation of this Project’s results.
The findings of the on-the-ground research at the Sorters’ facilities were extrapolated to obtain indications of volumes available in the focus countries per fibre type, shown in Figure 7 below. Considering the wide range of characteristics of textile products on the European market, extrapolating sample data to country level only provides an estimate of what the total volume might look like. However, presence of fibre types cannot be translated directly into feedstock for recycling, as 31% of fibres in the Fraction occur in blends.56 Most fibre-to-fibre recycling technologies currently at scale only accept textiles consisting of pure materials. The suitability of the Fraction as feedstock for recycling is further described in the next chapter.
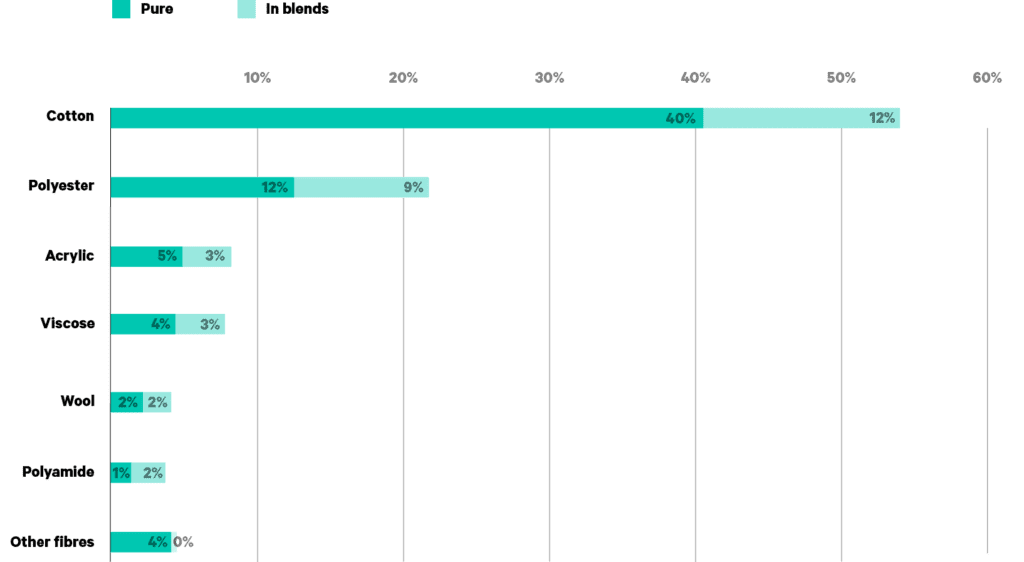
FIGURE 7: PRESENCE OF FIBRE TYPES IN THE FRACTION, OCCURRENCE AS PURE MATERIALS VS. IN BLENDS. SOURCE: CIRCLE ECONOMY AND FASHION FOR GOOD (2022)
Pure cotton is the most prevalent fibre type in the Fraction in the focus countries, but it is likely that a large share of this feedstock is actually contaminated with elastane. The sample was analysed using NIR technology. Whilst the use of this technology allows for efficient analysis of the composition of large amounts of textiles, there are limitations to its accuracy, as described in Annex II. One major limitation of the use of NIR is its limited ability to recognise the presence of elastane. Elastane is often added in cotton garments to optimise comfort and fit.57, 58 Elastane was detected in only 2% of this Project’s cotton sample, suggesting that a considerable share of the study’s feedstock claimed as pure cotton in Figure 7 may contain small amounts of elastane.
Whilst cotton is the dominant fibre type found in the Fraction, polyester is the world’s most produced fibre type. According to Textile Exchange’s 2021 Preferred Fiber and Materials Market Report, polyester accounted for 52% of world fibre production in 2020 and cotton for only 24%.59 There are a few possible explanations for this significant difference between the world’s fibre production and fibre types found in the Fraction:
- The world’s fibre production does not cater for the fibre need of producers of consumer textiles only. A considerable share of fibres produced are destined for workwear or technical textiles. For example, it is estimated that industrial textiles represent almost 20% of global fibre demand.60 Workwear and technical textiles are polyester-rich materials, hence a large proportion of the world’s polyester production most probably does not end up solely in consumer textiles and therefore contributes to the Fraction’s share of polyester being smaller than expected.
- The difference in fibre composition found could also reflect a preference from consumers in the focus countries for cotton products over polyester, or could be an effect of consumer disposal behaviour as they might regard polyester products as lower value and therefore, choose to dispose of them in household waste rather than giving it to charity for reuse. In this case, increasing collection rates of textiles from household waste to the collection bins would lead to an increased share of polyester found in the Fraction.
- The characteristics of today’s non-rewearable textiles are a direct effect of the market demand for second-hand textiles, feedstock for recycling, wipers and downcycling. As polyester is a more durable material than cotton, collected textiles with high polyester content might be more likely to be sold on domestic or global second-hand markets than products consisting of natural fibres, like cotton, that tend to wear out over time. On the other hand, demand for polyester-rich textiles as feedstock for recycling is currently limited because recycling technologies at scale are mostly mechanical and in search of natural fibres like cotton and wool. The same applies to the wipers industry, which has a strong preference for cotton-rich fabrics.
One of the common explanations for differences between world fibre production and the fibre types found in PCT is the delay between production and disposal. Assuming consumers use textile products for approximately four years implies that volumes collected today reflect the fibre production of 2017 when polyester accounted for 51% of world fibre production.61 62 The delay between production and disposal hence does not explain the significant gap between world fibre production and the share of polyester found in the Fraction.