Unlocking the Trillion-Dollar Fashion Decarbonisation Opportunity
Appendix
Methodology and Calculations
GLOBAL TEXTILES VOLUME CALCULATION
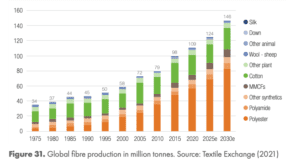
- In 2020, the total global textiles production volume was 109 million tonnes. (Source: Textile Exchange, 2021)
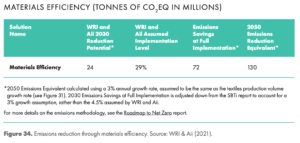
- Textile Exchange projects a 3% annual growth rate in fibre volume through 2030. Under the “business as usual” case, it is assumed the 3% growth rate continues through 2050, resulting in a total textiles production volume of 264 million tonnes in 2050. (Source: Textile Exchange, 2021)
- According to Ellen MacArthur Foundation, 54% of the global textiles volume is used by the apparel and footwear sectors (Source: Ellen Mac Arthur Foundation, 2017). The 3% growth rate is assumed to be constant for all sectors and that 54% of 2050 textiles volume is used by the apparel and footwear sectors (143 million tonnes).
PROJECTED GLOBAL FACILITY COUNT
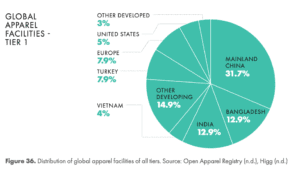
- The Open Apparel Registry database identifies 55,795 global Tier 1 and Tier 2 facilities as of 2020, including country locations.
- Using Higg FEM, the authors calculate that approximately 70% of those facilities are Tier 1 facilities and 30% are Tier 2 facilities.
- The authors assume there are an additional 16,553 Tier 3 facilities (approximately equal to the number of Tier 2 facilities), for a total of 72,348 global facilities in 2020.
- Using the projection for global textiles volume growth (Figure 31), it is assumed that 25% of the capacity growth will be absorbed by existing facilities, and that another 77,444 facilities will need to be added in order to absorb the remaining 75% of volume increase, resulting in 149,792 global facilities by 2050 (note that in reality the new facilities may not be identical in size to existing facilities, but for the purposes of this report, the amount of investment required is generally proportional to production volume, not facility count).
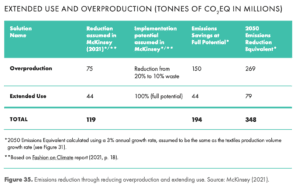
EMISSIONS REDUCTION CALCULATIONS
SIZE OF THE PRIZE CALCULATIONS
Note: All figures are reported in 2021 U.S. Dollars. The contemplated investments will take place over the next several decades. The authors have not applied an inflation factor or a discount rate. The cost of each investment is based on today’s cost, except where otherwise noted (e.g., renewable electricity).
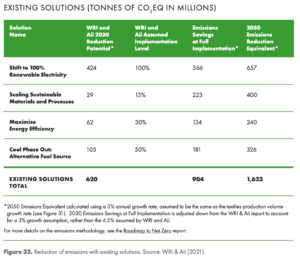
Renewable Electricity
- Using Higg FEM the average electricity use per facility was calculated for each tier and region. The global weighted average electricity use per facility is 8,251,954 kWh/year
- The global average capacity factor for solar energy in 2019 was 18%. The authors made the simplifying assumption that improvements in the capacity factor from technological advancement will be offset by installing renewable projects in regions with less ideal conditions (e.g., less sun exposure). (Source: International Renewable Energy Agency (IREA), 2020)
- Therefore, the average facility would require a solar system with a capacity of 5,233 kW to offset 100% of their electricity use
- The global average system cost is projected to be $587 per kW by 2030 (Source: IREA, 2021). The 2030 figure is used since the projects are assumed to be installed over the next two decades. It is further assumed that this cost applies for both on-site or off-site projects.
- Therefore, the average investment per facility is $3,071,979
- Using the projected 2050 global facility count of 149,792, it is assumed that 75% of facilities will install a renewable electricity source (and the remaining 25% either already have a renewable electricity source or will receive renewable electricity from the grid)
- For all projects, it is assumed an additional 10% cost of feasibility assessments, programming, and coordination amongst stakeholders
SCALING SUSTAINABLE MATERIALS AND PROCESSES
Mechanically-recycled Synthetic fibres
- It is assumed 53% of synthetic fibres are mechanically-recycled by 2050. Using the growth rates above, that results in 37 million additional metric tons per year of mechanically-recycled synthetic fibre.
- In order to source enough input materials (plastics), additional collection infrastructure will be required. This report uses a cost of $136 per ton (Source: Schneider, 2021), resulting in a collection infrastructure investment of $5.1 billion.
- The cost of new infrastructure to convert input materials (plastics) to new fibres is assumed to be $728 per ton (Source: Plastics in Packaging, 2020), resulting in a conversion infrastructure investment of $27.2 billion
- For both collection and conversion infrastructure, it is assumed an additional 10% cost of feasibility assessments, programming, and coordination amongst stakeholders ($3.2 billion)
- The total mechanically-recycled synthetic fibre volume produced between 2020 and 2050 is assumed to be 728 million metric tons based on an extrapolation of WRI and Aii Estimates. As of 2019, the cost premium of recycled fibre compared to conventional fibre was $72 per ton (Source: Ambrose, 2019), resulting in $52.4 billion required for the ‘Sustainability Premium’.
Preferred/Organic Cotton
- In this report, it is assumed 70% of cotton volume is preferred/organic cotton by 2050. Using the growth rates above, that results in 16 million additional metric tons per year of preferred/organic cotton
- The certification and training cost to incentivise farmers to switch to preferred/organic cotton is assumed to be $135 per ton (Source: Textile Exchange, 2019, pg. 49, assumes 1 year of expenditure with no production), resulting in a conversion investment of $2.1 billion
- For the conversion investment, it is assumed an additional 10% cost of feasibility assessments, programming, and coordination amongst stakeholders ($210 million)
- The total preferred/organic cotton volume produced between 2020 and 2050 is assumed to be 365 million metric tons based on an extrapolation of WRI and Aii estimates. As of 2019, the cost premium of recycled fibre compared to conventional fibre was $308 per ton (Source: Textile Exchange, 2019), resulting in $38.5 billion required for the ‘Sustainability Premium’.
Mechanically-recycled Cotton
- It is assumed 9% of cotton production volume is mechanically-recycled by 2050. Using the growth rates above, that results in 2.5 million additional metric tons per year of mechanically-recycled cotton
- In order to source enough input materials (post-consumer cotton), additional collection infrastructure will be required. This report uses a cost of $136 per ton (Source: Schneider, 2021), resulting in a collection infrastructure investment of $333 million
- The cost of new infrastructure to convert input materials (post-consumer cotton) to new cotton fibres is assumed to be $728 per ton (Source: Plastics in Packaging, 2020), resulting in a conversion infrastructure investment of $1.8 billion
- For both collection and conversion infrastructure, this report assumes an additional 10% cost of feasibility assessments, programming, and coordination amongst stakeholders ($212 million)
- The total mechanically-recycled cotton volume produced between 2020 and 2050 is assumed to be 41 million metric tons (using the growth rates and assumptions in the Global Textiles Volume Calculations in Figure 31). The cost premium for recycled cotton is assumed to be the same as preferred/organic cotton ($308 per ton), resulting in $12.6 billion required for the ‘Sustainability Premium’.
Maximise Energy Efficiency
- Using Clean by Design data for the average cost of energy efficiency improvements by region and tier (from $20,350 per facility up to $1,010,000), the global weighted average energy efficiency investment was calculated to be $178,924 per facility
- Using this reports projected 2050 global facility count of 149,792, it is assumed that 75% of facilities will implement an energy efficiency programme (and the remaining 25% have either already implemented a programme or are using state of the art production equipment)
- For all projects this report assumes an additional 10% cost of feasibility assessments, programming, and coordination amongst stakeholders
Coal Phase Out: Alternative Fuel Source
- Of all global facilities, this report assumes 100% of new facilities and 50% of existing facilities install a non-coal fired boiler / replace an existing coal-fired boiler, resulting in 113 million incremental metric tons of textile volume being processed at facilities that make an investment in a non-coal fired boiler
- The average natural gas mmBTU needed per metric ton of textile fabric is 27.7 (Source: American Council for an Energy Efficient Economy, 2005), so 3.15 billion mmBTU of new natural gas capacity will be needed
- The capital investment in a natural gas boiler per mmBTU is assumed to be $5.77 (Source: U.S. Environmental Protection Agency, 2013)
- Therefore, the total investment required to replace coal fired boilers with natural gas or equivalent boilers is $18.1 billion
- For all projects, this report assumes an additional 10% cost of feasibility assessments, programming, and coordination amongst stakeholders
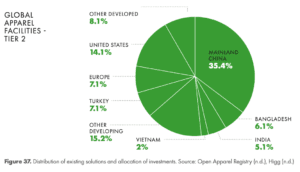
Methodology for facilities location by region
- The Open Apparel Registry database identifies 55,795 global Tier 1 and Tier 2 facilities as of 2020, including facility locations
- Using Higg FEM, the authors of this report calculated the ratio of Tier 1 to Tier 2 facilities in each region
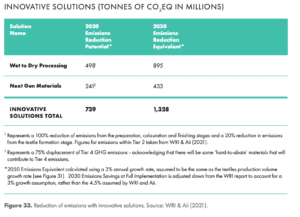
Innovative solutions
- The total financing requirement for innovative solutions is driven by a bottom-up methodology based on the maturity and financing profiles of carbon-focused innovators. The total figure is a function of the following components:
-
- The total number of innovators in Fashion for Good’s database in each innovation category with significant relevance to carbon abatement, multiplied by:
- The extent (%) to which those innovators are relevant, further corrected to account for the extent to which those innovators are covering the total requirement for innovation, resulting in c.2,500 companies to be financed, multiplied by:
- The capex required to scale each of those innovations for the first three phases (respectively: R&D, piloting, production at scale), further corrected for the fact that many innovations may not make it to the next stage (the innovation funnel). Used assumptions result in a 11% success rate from phase 1 to 2 and 23% success rate from phase 2 to 3. Assumed financing requirements are:
- Processing innovators: $5m, $25m, and $50m for phase 1-3 respectively;
- Materials: $10m, $50m, and $100m for phase 1-3 respectively.
- Added to the above is the amount of financing necessary to adopt the resultant winning solutions at scale (Phase 4), which may cover building sufficient number of material production plants or installing new processing equipment at manufacturing sites. These amounts are based on confidential insights from multiple innovators in Fashion for Good’s portfolio.
- Each of the resulting amounts for the four Phases and different innovation categories are subsequently allocated over the various financing categories, including high risk / high return venture capital vs. later stage debt.